Japan Earthquake | Page 2235
 ok, this is technical, not medicinal, right ?by Edano 8/25/2011 10:24:23 AM
 @Edano I did find they have this other study in english article.nuclear.or.krby elainekirk 8/25/2011 10:24:46 AM
- @Edano so we need @peter and @dean and @all to figure it?by elainekirk 8/25/2011 10:25:23 AM
- @ikrockhopper so you must go and relax and sleep and when you wake we may understand it for you and put it in user friendly :)by elainekirk 8/25/2011 10:26:12 AM
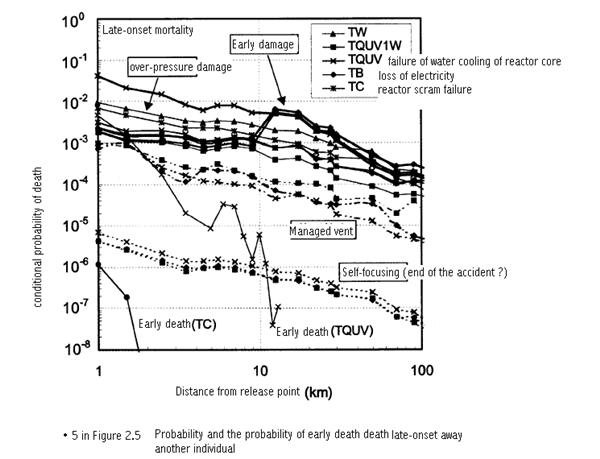
- @elainekirk i will try to understand it. need some time. what is the general theme of the diagram ?by Edano 8/25/2011 10:26:33 AM
 All the information need to understand the fig.
y= conditional probability of death.
x= distance from a plant emitting radioactive, by km.
The two sharply-dropping lines show acute death.
Other bunches of lines (more flat than the two lines) show late-onset death probability.
For lines: TQUV= failure of water cooling of reactor core, TB= loss of electricity, TC= reactor scram failure. (I dont think other are that important.)
The box on the top in the fig (left hand side one) = 過圧破損 = over-pressure damage (?). Another box on the top (right side) = 早期破損 =Early damage (it says... I don't know what it means). The middle box =管理放出 =Managed vent. Right-hand side bottom = 事故終息 = end of the accident.by ikrockhopper 8/25/2011 10:28:03 AM- According to the JP text,
They used OSCAAR (no full name, but JP says... Conditional probabilistic environmental effect estimation code) to make the figure. More info is on the article Elaine found.
This fig shows relationships between acute and late-onset death probability and distance from the emitting place by reactor core damage sequences and container vessel damage scenarios.by ikrockhopper 8/25/2011 10:30:05 AM - ok, i try to understand it. some moments please.by Edano 8/25/2011 10:32:07 AM
- Thank you so much, Mr. Edano!
Sorry I've got to go! Would be wonderful if we could understand the figure!
1) They already estimated in 2001 and reported in 2002 the risk after damages to a vessel, but didn't use the info at the incident.
2) The risk will be convincing to Japanese (the skeptics) because it was estimated by the Japan Atomic Energy Research Institute, which runs Monju reactor and others!
Talk to you soon!by ikrockhopper 8/25/2011 10:33:35 AM - @ikrockhopper rest well rockhopperby elainekirk 8/25/2011 10:39:33 AM
- @Edano you are a starby elainekirk 8/25/2011 10:39:59 AM
- @elainekirk Thank you! If I have energy, I will stop by when I got back home (two hours later from now.) If not, could you tell me what you find via email? Thank you!by ikrockhopper 8/25/2011 10:42:09 AM
- @ikrockhopper we will I will send all @edano findings emailby elainekirk 8/25/2011 10:43:51 AM
 Morning all (afternoon - evening)by lillymunster 8/25/2011 10:49:41 AM
- @Edano can you make sure I get whatever you come up with on Rockhopper's data so I can add it to the info on radiation studies I am compiling.by lillymunster 8/25/2011 10:51:30 AM
the translation
by Edano 8/25/2011 10:56:19 AM- there are more lines in the graphic than explained.by Edano 8/25/2011 10:59:11 AM
- @Edano @lillymunster good morning I will open an email and copy everything in so none of edano's work gets lostby elainekirk 8/25/2011 10:59:49 AM
- Elaine - what version of the document should I use? I need to reboot then will go back and grab all of rockhopper's translation comments.by lillymunster 8/25/2011 11:01:23 AM
- i think always a bunch of (parallel) lines belong together.by Edano 8/25/2011 11:03:27 AM
- there are 4 types of damage: overpressure, early damage, managed vent and "self-focusing" (?) each damage can be combined with the events (the lines) of TW (?), TQUV1W (?), failure of water cooling (LOCA), loss of electricity and scram failure.by Edano 8/25/2011 11:06:16 AM
- the probability: 10^0 = everyone will die, 10^-1 = 1 of 10 will die, 10^-2 = 1 of 100 will die, 10^3 = 1 of 1000 will die .... aso.by Edano 8/25/2011 11:08:44 AM
- i don't understand the two lines that go sharply down (early death). they are extra.by Edano 8/25/2011 11:11:28 AM
- @lillymunster we only have the japanese the english one is not the same docby elainekirk 8/25/2011 11:13:29 AM
- So who posted the original document so I know what one to go grab. There was a few docs and links posted.by lillymunster 8/25/2011 11:14:59 AM
- @Edano it totally confused me I will keep looking for the English version there must be one if the iaea have filed itby elainekirk 8/25/2011 11:15:11 AM
- @lillymunster iwill put them here
rockhopper was talking about the graph page 66 on twitter
www.iaea.org
the graph is also in this doc
blog.goo.ne.jp
I went to find an English versiion and found this but it is not the doc it looks like a reference doc
article.nuclear.or.krby elainekirk 8/25/2011 11:15:28 AM - the two sharp downfalling lines may be acute deaths, the rest is long term deaths. but i think you knew that.by Edano 8/25/2011 11:17:15 AM
- @Edano I think rockhopper did I was quite worried I think it must have hit twitter from another and she was trying to make sense of itby elainekirk 8/25/2011 11:19:35 AM
- the diagram may explain the 20 km exclusion zone. all curves go down beond 20 km away from the plant.by Edano 8/25/2011 11:19:51 AM
- 20 km away will cause max. 1 out of 500 deaths, an exclusion zone of 100 km will cause max. 1 out of 5000 deathsby Edano 8/25/2011 11:22:53 AM
- So is the postulated accident something beyond Fuku more like Chernobyl?by lillymunster 8/25/2011 11:24:00 AM
- @Edano this doc what is it it looks to be the same info presented more clearly www.ansn-jp.orgby elainekirk 8/25/2011 11:24:01 AM
- @lillymunster that doc I just posted looks to use fuku as a model it is english but the techi is over my headby elainekirk 8/25/2011 11:24:44 AM
- the fuku accident is the topmost line (failure of cooling + overpressure damage), i would say.by Edano 8/25/2011 11:25:43 AM
- @elainekirk as in they ran numbers on deaths etc. for this accident and didn't share it with the public?by lillymunster 8/25/2011 11:25:48 AM
- @Edano @lillymunster I wouldnt like to say lilly I will leave it to others to decideby elainekirk 8/25/2011 11:26:50 AM
- the diagram is an estimation of deaths in a specific type of accident, dependent on the distance to the plant. i don't know if this is specific to a distinct plant or not.by Edano 8/25/2011 11:27:39 AM
- @Edano so likely ran numbers on various scenarios and fuku fits one of them. For a minute I thought they ran this after fuku melted down...by lillymunster 8/25/2011 11:28:32 AM
- does anyone know if the doc is related to a specific plant ?by Edano 8/25/2011 11:28:44 AM
- @lillymunster : i think such estimations are part of the admission process of any nuke plant.by Edano 8/25/2011 11:29:30 AM
- the government can then check if the plant can be built there or not, depending on the population density, and they can set evacuation zones based on this.by Edano 8/25/2011 11:31:13 AM
- @Edano an. makes more sense. Still probably not something they usually release to the public.
Elaine, if you can send me the string of comments from Edano I grabbed rockhopper's comments and the links you posted. Will try to get something put together after I write the N Anna thing this morningby lillymunster 8/25/2011 11:31:28 AM - yep, i am quite sure. it is part of the nuke planning.by Edano 8/25/2011 11:31:55 AM
- it makes sense because the gov first evacuated 3 km (?) around the plant based on the severity on the accident, and then extended the zone as the accident worsened according to this diagram.by Edano 8/25/2011 11:34:10 AM
Japan Earthquake | Page 2235
- Who's Blogging
-
 hudebnik
 alblee
 UKVal
UKVal Oliver (ScribbleLive)
 Jonathan Keebler
 kaykodh
 PKelley
 Markfm
 Angie
Angie Deb
Deb Mid Valley
 Pedro Jesus
 Matt (ScribbleLive)
 George Gibb
- elainekirk
- lillymunster
 dean
dean bo
bo- Edano
 IanGoddard