Japan Earthquake | Page 2670
 @lillymunster i guess they really mean the entire inventory, because most of the contamination went into the sea.by Edano 11/16/2011 6:20:51 PM
- another study:
Assessment of individual radionuclide distributions from the Fukushima nuclear accident covering central-east Japan www.pnas.org
full text: www.pnas.orgby Edano 11/16/2011 6:23:57 PM  @Edano yuk that is not goodby lillymunster 11/16/2011 6:26:05 PM
- the latter study includes tellurium contamination.by Edano 11/16/2011 6:29:07 PM
 Decontamination system starts up for unit 2 spent fuel pool
16 November 2011
TEPCO has launched a radiological decontamination system for the unit 2 spent fuel pool. TEPCO said that the system needed to start before a desalination system that is also planned, since highly radiological concentrated seawater is difficult to treat.
www.neimagazine.comby M.I.A. 11/16/2011 6:30:24 PM- Große Mengen Cäsium 137 auf Japans Boden www.spiegel.deby Edano 11/16/2011 6:31:50 PM
 @all An Armenian Nuclear/Earthquake Parable
cranswick.netby smoss 11/16/2011 6:49:14 PM- News of the Obvious: Parts of Japan unsafe for farming. latimesblogs.latimes.comby lillymunster 11/16/2011 7:28:43 PM
- Have the chernobyl map done. It shows a pattern and the pattern also follows the land topography.... Will have it posted here in a few minutes. If you have time please give feedback on this, I need more eyes on this.by lillymunster 11/16/2011 7:45:45 PM
- I have been searching and digging thru the Ukrainian and Russian websites. I cannot find another monitoring site. @lillymunster. But I found the clip of the start of the monitoring of the Chernobyl area. They have a lot of catching up to do. Looks primitive to say the least.
In the exclusion zone presented a system of radiation monitoring
24tv.uaby Liz 11/16/2011 7:48:19 PM - @Liz cool, will check it out. It is really sad that the Ukraine sort of got Chernobyl all dumped on them when the USSR broke up but didn't get the resources to deal with it too. It has got to be a massive drag on their country.by lillymunster 11/16/2011 7:59:34 PM
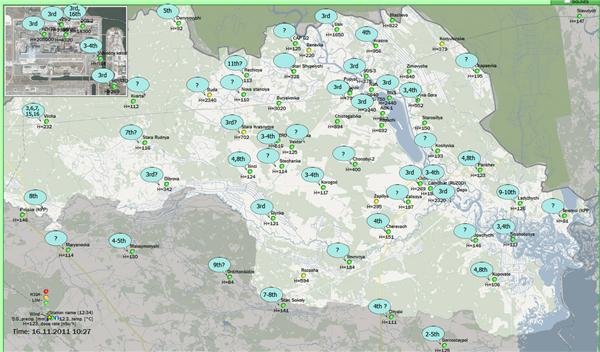
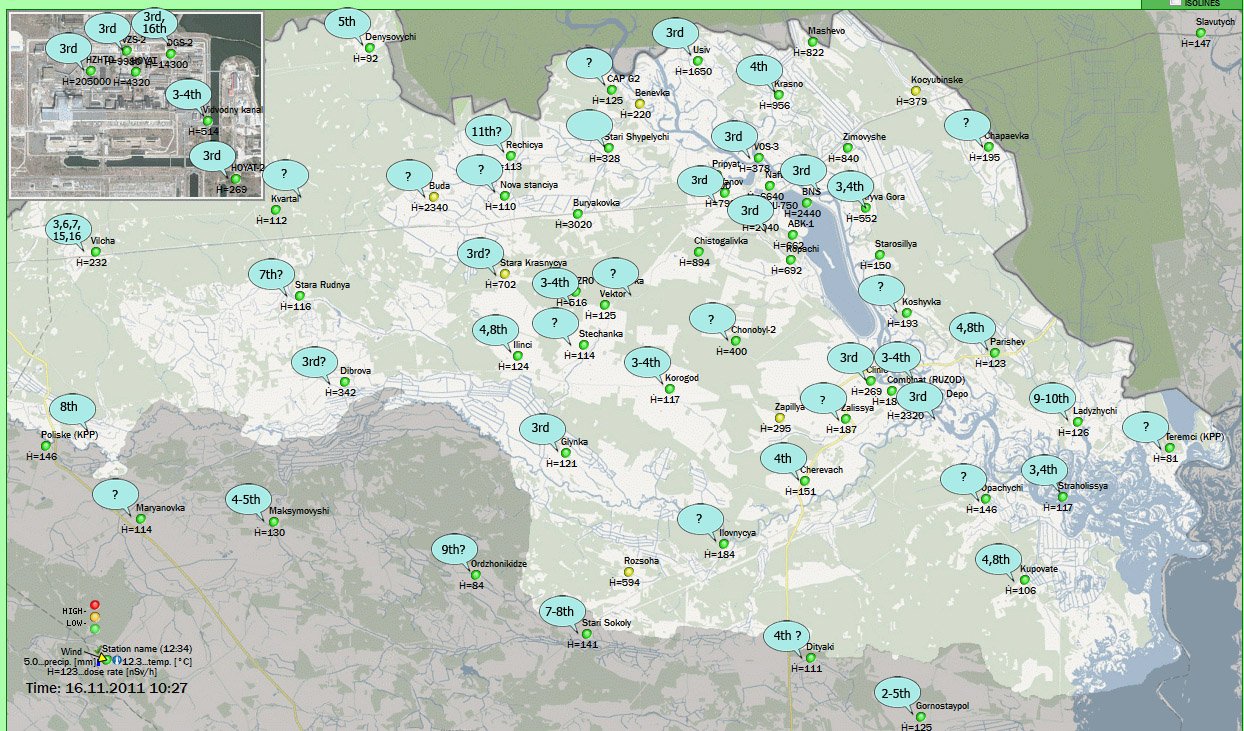
Here is the map. Use the link below it (in the grey text) for the full sized version. Working on getting the spreadsheet online. www.houseoffoust.com
by lillymunster via Houseoffoust 11/16/2011 8:01:41 PM- @lillymunster the small map is chernobyl ?by Edano 11/16/2011 8:07:39 PM
- hmm i don't quite understand the map. this is not entire ukraine ?by Edano 11/16/2011 8:13:43 PM
- @Edano yes, that is the chernobyl region of Ukraine. Their radiation network only covers the NE corner of the country. Ukraine of all places does not have a full national radnet.by lillymunster 11/16/2011 8:14:16 PM
- I have the larger map and link to download the spreadsheet in the peer review section of the website. It can be found here: wp.meby lillymunster 11/16/2011 8:14:40 PM
- @lillymunster ah, that's why i couldn't find kiev. :)by Edano 11/16/2011 8:15:05 PM
- going to make an overlay on Ukraine to show where this area is.by lillymunster 11/16/2011 8:15:57 PM
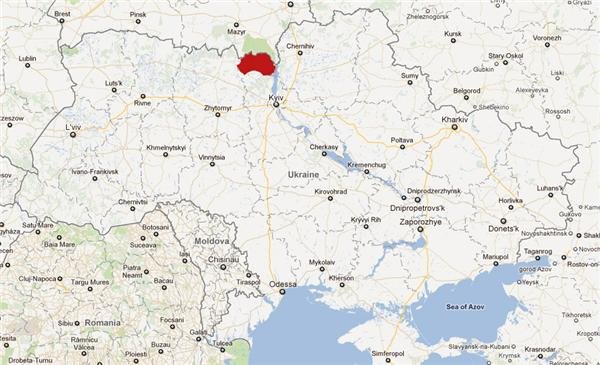
Image to give an idea how tiny the area under the radiation network is:
by lillymunster 11/16/2011 8:25:08 PM @lillymunster blimey!by elainekirk 11/16/2011 8:30:36 PM
- This has a current level of radiation in Kiev but no historical data. :-( www.mns.gov.uaby lillymunster 11/16/2011 8:31:14 PM
- @lillymunster , if the numbers in the bubbles are dates, the station with the earliest time point of detection is Gornostaypol at the bottom right, which means the source is not Chernobyl.by Peter 11/16/2011 8:31:53 PM
- If the IAEA maybe spent more money and manpower dealing with Chernobyl rather than defending the nuclear power industry..... One would think a decent public network in Ukraine would be a good idea.by lillymunster 11/16/2011 8:32:06 PM
- @Peter look at the spreadsheet, some of these blips are not huge. I wanted others to look at the spreadsheet to see if these spikes are what people would consider real spikes. The spike on the 2nd consists of one reading but it was a jump from 146-337-117 over 10 minute increments so it may be a fluke and might need to be changed.by lillymunster 11/16/2011 8:34:39 PM
- The later jump on the 5th has 3 readings 20 minutes apart of 270 with drops back down to more normal 130-120 range. So the jump on the 2nd for Gornostaypol was a single jump in a 10 minute incriment thus might be a fluke.by lillymunster 11/16/2011 8:36:54 PM
- Vilcha is another one with odd data. It seemed to jump up every few days. Not sure if that station just gets lots of peaks and valleys in the readings or if it actually means something.
The box in the upper left of that map with the dates on it, that box is monitor stations at the plant. I noticed a solid trend of the stations inside the complex and around it on the 3rd.by lillymunster 11/16/2011 8:40:13 PM - @lillymunster is there a pattern of intensity ? is the plant data higher than outside ?by Edano 11/16/2011 8:42:10 PM
- nice sunrise in fuku, btw !by Edano 11/16/2011 8:43:00 PM
- @Edano background levels are of course higher near the plant. Are you thinking like are the spikes bigger closer to the plant?by lillymunster 11/16/2011 8:46:58 PM
- @lillymunster yes :)by Edano 11/16/2011 8:47:14 PM
- lilly, whether spikes are meaningful or not can only be decided on the history of past recordings. Doubling of readings commonly is a good first indication that something was going on. Many stations seem to respond by the 3rd. Therefore, the ones that picked something up earlier are important. Do we know which way the winds blew at the time?by Peter 11/16/2011 8:48:05 PM
- @Peter. I pulled data Oct 1 to Nov 1 and that is what they wonky database spewed out. I could try pulling a sept to oct full set if people want to look at it. I did some individual site checking where I pulled up the previous month and it looked less high or spiked but did not do all stations. So I can pull another report for that as comparison.
@Edano, I will look at that and make some notes. I do know that the trends closer to the plant were more solid trends. Will crunch some numbers for those sites to see intensity.by lillymunster 11/16/2011 8:57:31 PM - @lillymunster The mapping looks great (and like alot of work)! Offering this for comparison, if interested. Global Radiation Patterns
(post Chernobyl) users.owt.comby smoss 11/16/2011 9:01:50 PM - @lillymunster , I'd look at the history of only that station and see whether it records such spikes more often. A month may be enough.by Peter 11/16/2011 9:04:07 PM
- @Peter so what stations should I pull?by lillymunster 11/16/2011 9:10:36 PM
- @lillymunster , Gornostaypol!by Peter 11/16/2011 9:11:43 PM
- @Edano - the charts for each station render as an image. So I can't pull a column of numbers. Thoughts on the number crunching for finding spike intensity. IE: high-low of non spike range? Number of readings and difference between normal high-low for the spikes? Trying to avoid hand keying in entire columns of data if I can help it.by lillymunster 11/16/2011 9:13:28 PM
- Gornostaypol september data. Brief one reading jumps into the high 200-low 300 seem to happen, sustained or close together jumps into 200 range do not. So the one on the 2nd looks more normal. The one on the 5th a weak trend. Will save the table into the spreadsheet for comparison.
The 200+ readings for Sept. are all a full day or hours apart.by lillymunster 11/16/2011 9:24:43 PM - Updated the peer review page to reflect Gornostaypol new info.by lillymunster 11/16/2011 9:37:13 PM
- @lillymunster , one way to analyze data of this nature is called surprise analysis. I am looking for a good reference. But on the search I found this en.wikipedia.org , which resembles what we are trying to identify. It is called a Black Swan.by Peter 11/16/2011 9:40:19 PM
- @Peter will take a look at that and see if it gives some ideas how to compare this all.by lillymunster 11/16/2011 9:44:55 PM
- Did one station at the plant for spikes. Found it interesting. Will do the rest vs non station (further away). Inside the plant spikes were long
Station: DGS-2
high 14700
low 13900
spike high 14900
spike low 14700
duration of spike(s)
Oct 3rd - 10 hours
Oct 16th - 8 hoursby lillymunster 11/16/2011 9:45:42 PM - @lillymunster this is awesome research being done hereby elainekirk 11/16/2011 9:46:06 PM
- @elainekirk thanks, so hard to tell for sure. I wish they did isotope testing near the plant on a regular basis and posted it.by lillymunster 11/16/2011 9:46:46 PM
- Does anyone remember why we were only getting Iodine readings out of Fuku in the early weeks and no other isotopes until later on?by lillymunster 11/16/2011 9:47:46 PM
Japan Earthquake | Page 2670
- Who's Blogging
-
 hudebnik
 alblee
 UKVal
UKVal Oliver (ScribbleLive)
 Jonathan Keebler
 kaykodh
 PKelley
 Markfm
 Angie
Angie Deb
Deb Mid Valley
- Pedro Jesus
 Matt (ScribbleLive)
 George Gibb
- elainekirk
- lillymunster
 dean
dean bo
bo- Edano
 IanGoddard