Japan Earthquake | Page 1367
 so we need to import this spreadsheet into your visualizer.by Edano 5/25/2011 12:53:16 AM
- unfortunately i have not much experience with html and php. i prefer offline scripts.by Edano 5/25/2011 12:58:38 AM
 @Edano I could mess with the html end of it. Is the visualizer back end scripting in php? I didn't look at it closely. Is RadioGuy's spreadsheet set to auto update?by Nancy 5/25/2011 1:00:00 AM
- @Nancy i think it's manually only. and the controls are grayed out. he would have to permit editing i guess.by Edano 5/25/2011 1:02:11 AM
- @Edano Take a quick look at this page, in the example code there is a URL. Is that the URL of the spreadsheet we are using? This is the line of code <script type='text/javascript' src='https://www.google.com/jsapi'></script>
link code.google.comby Nancy 5/25/2011 1:02:21 AM - @Edano Ok, so the auto updating of the spreadsheet is where we are stuck. I have no clue how to get the csv feeds to act on the spreadsheet.by Nancy 5/25/2011 1:02:59 AM
- I think we just bored everyone to death. :-)by Nancy 5/25/2011 1:03:30 AM
- this should be the data scource: "src='https://www.google.com/jsapi'"by Edano 5/25/2011 1:04:50 AM
- sending a request to a spreadsheet: code.google.comby Edano 5/25/2011 1:07:06 AM
- @Edano So the full URL of Radioguy's spreadsheet goes there. It threw me because of the short URL that looks different than google dog URLS.by Nancy 5/25/2011 1:07:23 AM
 @Nancy @Edano - Radioguy's spreadsheet can supply the data to drive the Google Gadget: Gauges.
From your Google Documents account you open the existing spreadsheet.
Select the gauge field in the doc, then go to - Insert > Gadget > Charts > Gauges
From there on I'm kinda lost...by Rob in SF 5/25/2011 1:07:26 AM- Select a field for the gauge in the doc...by Rob in SF 5/25/2011 1:08:14 AM
- function initialize() {
// Replace the data source URL on next line with your data source URL.
var query = new google.visualization.Query('http://spreadsheets.google.com?key=123AB&...');
// Optional request to return only column C and the sum of column B, grouped by C members.
query.setQuery('select C, sum(B) group by C');
// Send the query with a callback function.
query.send(handleQueryResponse);
}
function handleQueryResponse(response) {
// Called when the query response is returned.
...
}
"google.visualization.Query('http://spreadsheets.google.com?key=123AB&...')" is the spreadsheet address.by Edano 5/25/2011 1:08:58 AM - @Edano, Rob, I think I might be able to muck my way through this. I need the URL for RadioGuy's spreadsheet. It will need a way to auto update the fields though. I have no clue how to do that. '=_by Nancy 5/25/2011 1:09:01 AM
- Once the gauge app(s) is in the doc, it can export the "chart" to HTML.by Rob in SF 5/25/2011 1:09:17 AM
- So we still need to determine how to auto update the spreadsheet from the csv filesby Nancy 5/25/2011 1:10:18 AM
- @Nancy We need a feed. Or get a bot/script to retrieve and port the CSV data on intervals.by Rob in SF 5/25/2011 1:10:18 AM
- @Rob in SF do you have a feed address for the data?by Nancy 5/25/2011 1:10:40 AM
- @Nancy : i think only radioguy has the permission to change the attributes so the spreadsheet can suck the data periodically.by Edano 5/25/2011 1:11:07 AM
- @Nancy : the URL is spreadsheets0.google.com if you mean that.by Edano 5/25/2011 1:12:05 AM
- @Edano I can check with him on the permissions. We need a plan on auto updating the data. Is there something that SPEEDI page used that might work.by Nancy 5/25/2011 1:12:17 AM
- Here's Google Code on the API to auto-port the CSV to the doc.
wdssii.nssl.noaa.govby Rob in SF 5/25/2011 1:12:31 AM  elaine made the GOOGLE..by dean 5/25/2011 1:12:41 AM
- Ooops... code.google.comby Rob in SF edited by elainekirk 5/25/2011 1:12:50 AM
- I did a search.. WAY TO GO .. whooooooo hooooooooby dean 5/25/2011 1:13:00 AM
- @Rob in SF : aha ..... approaching.by Edano 5/25/2011 1:13:26 AM
- @Dean - how so?by Nancy 5/25/2011 1:13:33 AM
- I did a google .. fukushima cvs data..by dean 5/25/2011 1:14:07 AM
- so we need the live feed and the automatic import. and then pass it to visualization.by Edano 5/25/2011 1:15:51 AM
 @dean you should ask veenie for the search he did - that was really scary had to drink gallons coffee to calm me downby elainekirk 5/25/2011 1:17:11 AM
- lol he he elaine.. the internet is a strange world huh
it sure is Deanby dean edited by elainekirk 5/25/2011 1:17:36 AM - @Edano Yes. I sorta understood the uploading info, the java version used a URL to call a CSV file. I'm not making any promises.by Nancy 5/25/2011 1:19:56 AM
- Is Elaine Famous?
Noo not this one anyway :)by Nancy edited by elainekirk 5/25/2011 1:21:38 AM - ms google = elaine..by dean 5/25/2011 1:22:05 AM
- I just copied Radioguy's spreadsheet so I could edit it. Then added a row and added the gadget. I couldn't get it to display the data, but there is a drop down to PUBLISH the gadget which generates the HTML code for the website. Very cool.by Rob in SF 5/25/2011 1:22:36 AM
- Need someone who's good with Excel...by Rob in SF 5/25/2011 1:23:12 AM
- @Rob in SF I will talk to RadioGuy when he has time. Maybe we can get the update sorted out. I think the visualization part is the easier side of it.
by Nancy 5/25/2011 1:24:31 AM 
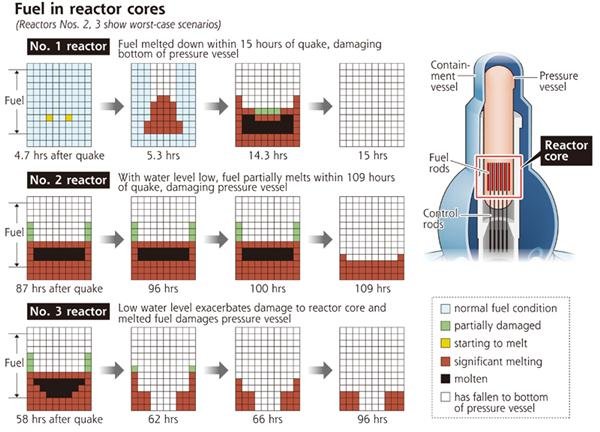
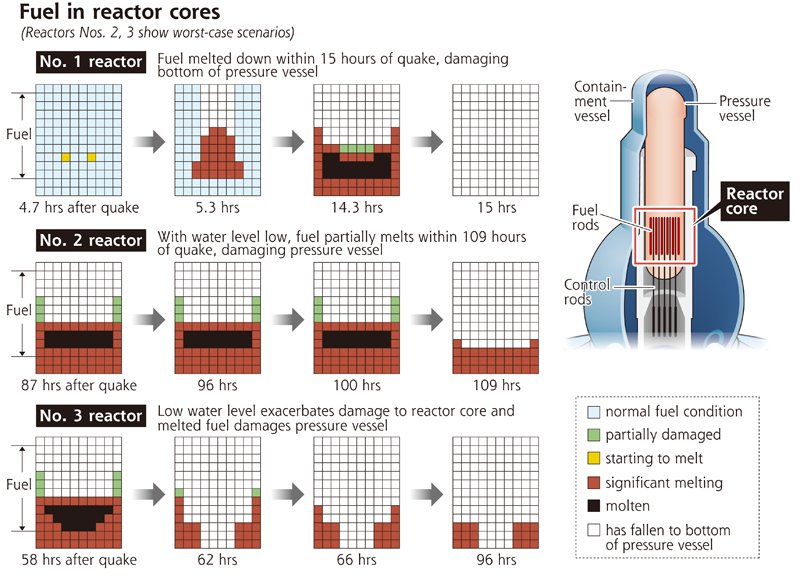
TEPCO describes 3 meltdowns / Report on Fukushima N-plant outlines downward spiral of events
www.yomiuri.co.jp
Tokyo Electric Power Co. admitted for the first time Monday the Nos. 2 and 3 reactors at the Fukushima No. 1 nuclear power plant likely suffered core meltdowns, in addition to a previously acknowledged meltdown in the No. 1 reactor...
The report was submitted to the Nuclear and Industrial Safety Agency of the Economy, Trade and Industry Ministry.
As much as 800 kilograms of hydrogen was generated as a result of the overheating of nuclear fuel at the No. 1 reactor, according to TEPCO. The amount was enough to destroy the reactor building, according to nuclear experts...
www.yomiuri.co.jpby estacion via Yomiuri.co.jp 5/25/2011 1:32:23 AM- @Nancy dean set me of looking for myself and the first result was my google profile, anyone can make one and you can add links while I was there I added this site and when the site goes live can add that and if everybody does it that is a lot of linkthroughs which google would see as legitimate as they are personal reccomendationsby elainekirk 5/25/2011 1:33:35 AM
- good idea elaine..by dean 5/25/2011 1:34:05 AM
- @dean it is very quiet today I think the weather is affecting many in different waysby elainekirk 5/25/2011 1:41:43 AM
- @estacion do we know why tepco have chosen that kind of graphics it seems very limiting given the tools availableby elainekirk 5/25/2011 1:42:56 AM

Video from camera guys pan today
by deb 5/25/2011 1:46:25 AMPart #2
by deb 5/25/2011 1:47:52 AM- @elainekirk: I think these grafics represents the rods matrix sensor in reactors.by estacion 5/25/2011 1:48:33 AM
Japan Earthquake | Page 1367
- Who's Blogging
-
 hudebnik
 alblee
 UKVal
UKVal Oliver (ScribbleLive)
 Jonathan Keebler
 kaykodh
 PKelley
 Markfm
 Angie
Angie Deb
Deb Mid Valley
- Pedro Jesus
 Matt (ScribbleLive)
 George Gibb
- elainekirk
 lillymunster
- dean
 bo
bo Edano
Edano IanGoddard