Japan Earthquake | Page 2272
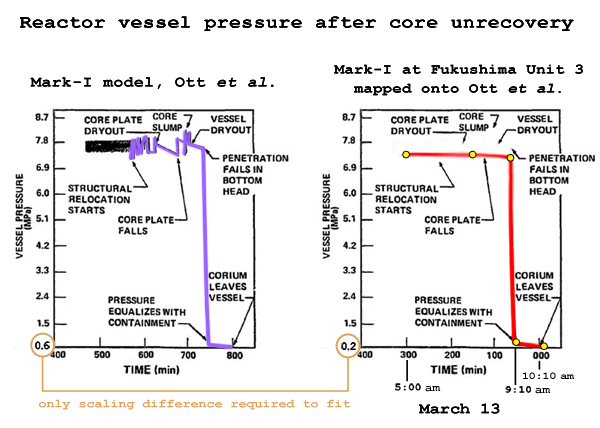
 @lillymunster pressure. in #3, corium leaves the vessel at 10:10, March 13. ian succeeded in synchronizing tepco's pressure data with the meltdown predictions by Ott. the model fits exactly.by Edano 8/29/2011 11:05:35 PM
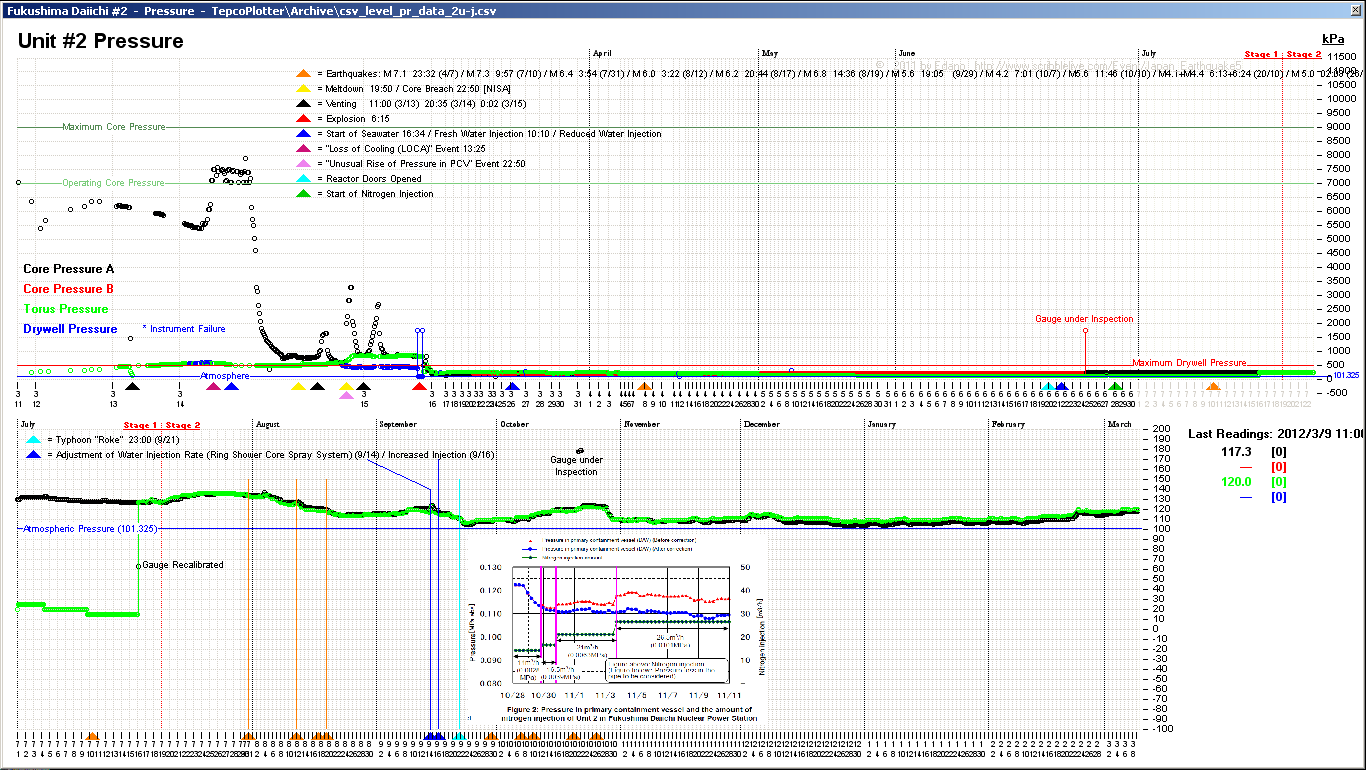
- if i transfer the model to #2, the the corium must have left the vessel around 19:00, March 14.by Edano 8/29/2011 11:08:22 PM
 @Edano yes I saw that, wanted to make sure I understood correctly that it was pressure drops. Does 2 have a stretch that matches also? Are these before the explosions or after?by lillymunster 8/29/2011 11:08:49 PM
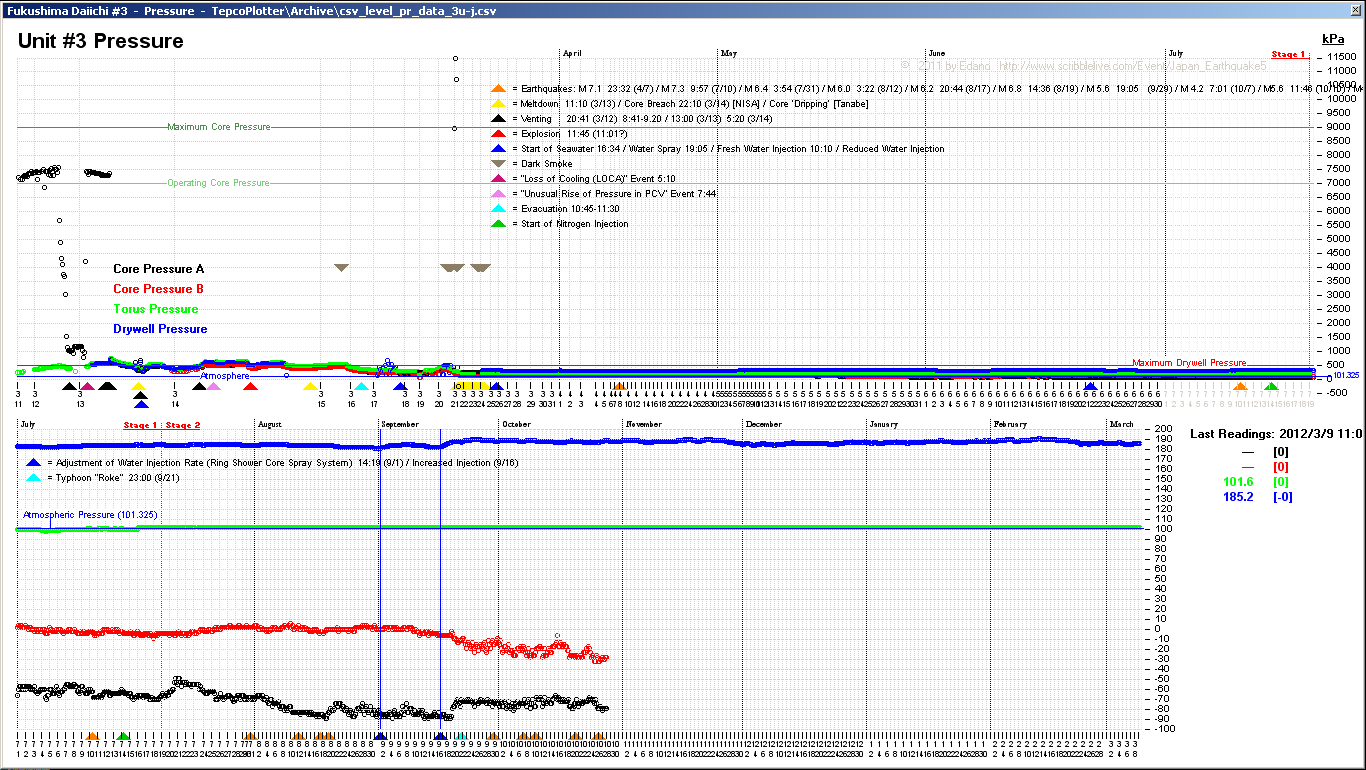
 @Edano, could you purdy please post a sharp zoom on all the #3 pressure data for March 13, especially for Core Pressure A? :) And what's the difference between A and B? What I've been told elsewhere is that they should be the same.by Ian 8/29/2011 11:12:08 PM
- @lillymunster i hope ian does another drawing for #2 as well. explosions: in #2 ~11 hours after corium left vessel, in #3 ~25.5 hours after corium left the vessel.by Edano 8/29/2011 11:12:09 PM
 Zion NPP, where the test data was collected, is being decommissioned ( www.nrc.gov ), which leaves San Onofre and Diablo Canyon which had seismic trips installed in 1983.by Peter Melzer 8/29/2011 11:12:44 PM
- @Ian i made a zoom for march 13, #3 pressure. you want it differently ?by Edano 8/29/2011 11:14:53 PM
 @Ian Nice work. I think you're onto something with your earlier timing for #3. Might the earlier pressure drop be accounted for somehow by the HPCI automatically kicking in an hour or so after the RCIC tripped at 11.36 3/12? According to the records Peter posted earlier the HPCI finally stops working for some reason at 2.44 3/13.by es 8/29/2011 11:15:05 PM
- #2 fits exactly into the model. even the "ground zero" point for corium leaving the vessel is at 0.6 MPa, as predicted.plus we have the predicted pressure jumps on corium cement reaction.by Edano 8/29/2011 11:22:22 PM
- @Edano, yes but it doesn't zoom on the Pressure A data, just the lower down data points. Does #2 pressure fit with both Ott et al. and the official meltdown estimates?by Ian 8/29/2011 11:30:04 PM
- @Ian no, the official (NISA) estimates are much later.by Edano 8/29/2011 11:31:17 PM
- @Ian i can do the zoom as you like but i have to rewrite the plotter program. this will need some time, maybe 2 or 3 days......by Edano 8/29/2011 11:32:35 PM
 @Ian FYI, that same data is also still live in this docs.google.com spreadsheet. It sucks all of the TEPCO update csv's in live, so it takes a minute or two to load.by RadioGuy 8/29/2011 11:32:50 PM
- Since each sheet uses the importData feature of googledocs, it has the original gibberish headers.by RadioGuy 8/29/2011 11:34:04 PM
- @es, thanks! I don't know if that's the explanation for the first drop.by Ian 8/29/2011 11:34:18 PM
- Edano deserves credit too because he tracked down that graph in Ott et al. during our discussion as a way of evaluating the pressure data. Then it dawned on me to map the data into it.by Ian 8/29/2011 11:36:01 PM
- Unlike @Edano's I didn't save the originals, so these are what TEPCO is reporting now for those early readings.by RadioGuy 8/29/2011 11:36:17 PM
- Ian, edano, have you checked this tepco document on unit 3 MAAP analysis results out: www.tepco.co.jp .by Peter Melzer 8/29/2011 11:36:37 PM
- @lillymunster according to the new model, the explosion in #2 occured when corium was already 11 hours on the drywell bottom. this is important, because the explosion damaged the drywell bottom where it is connected to the torus. the explosion seems to be caused by corium-concrete-reaction and the developing hydrogen from that. before the explosion, there was an increase in drywell pressure way over maximum, and after the explosion the pressure dropped to atmosphere.by Edano 8/29/2011 11:37:25 PM
- @Ian Oh, also, they're raw from the feed. There's no conversion.by RadioGuy 8/29/2011 11:44:04 PM
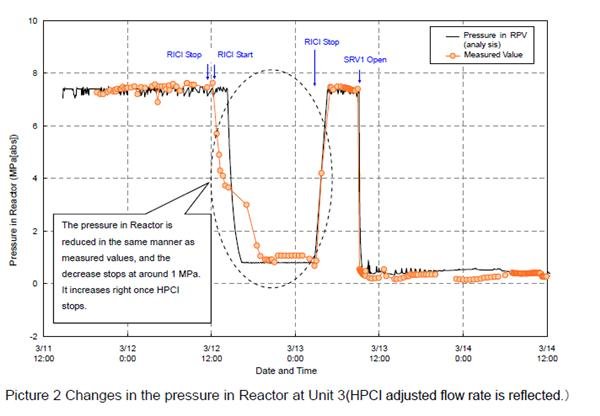
@Peter Melzer @Ian : damn, this really explains the initial pressure drop, esp. in #2 ! it is really the HPCI @es
by Edano 8/29/2011 11:48:10 PM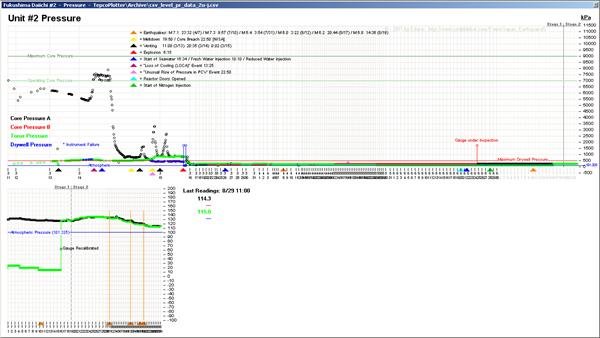
www.houseoffoust.com compare it to this (black curve)
by Edano via Houseoffoust 8/29/2011 11:49:22 PM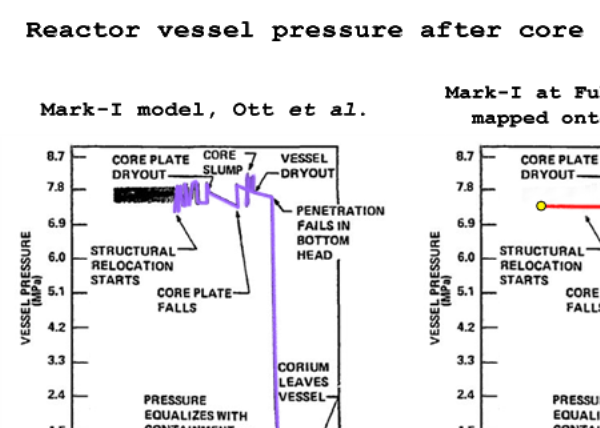
iangoddard.com and to this (left)
by Edano via Iangoddard 8/29/2011 11:50:23 PM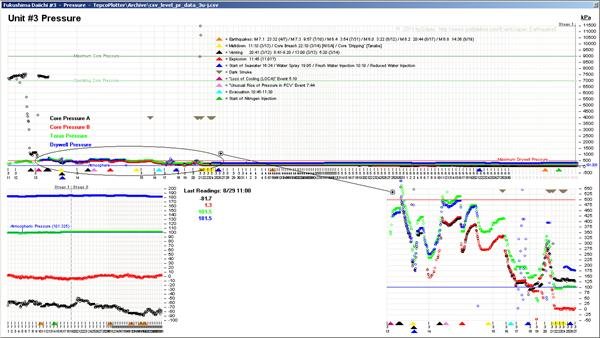
www.houseoffoust.com the initial pressure drop in #3 for comparation (HPCI?)
by Edano via Houseoffoust 8/29/2011 11:53:59 PM- @Peter Melzer @RadioGuy, thanks guys! That data is much easier to read than the raw data at Tepco. And Peter, "Factors of fluctuation in plant parameters..." is a vital document to know wrt this topic. Does it also pertain to the final huge pressure fall, or just the odd drop and recovery before the final fall? If they're saying the final fall isn't related to a meltdown, I have to get skeptical, especially given what happened the next morning, kaboom!by Ian 8/29/2011 11:55:16 PM
- @Edano, please don't worry about re-writing the program, no big deal at all.
by Ian 8/29/2011 11:57:51 PM - @Ian there are lots of aspects to be cross-checked for this theory. but the graphs fit perfectly, it is very convincing. i will see if i get a zoom into #3 core pressure for the first 2 days done tomorrow. today is too late for me...by Edano 8/29/2011 11:59:04 PM
- @Edano , only the labels in the graph are totally confusing. RICI does not exist. They may have meant RCIC. The starts and stops conform with the time stamps in the tepco tables elsewhere.by Peter Melzer 8/29/2011 11:59:28 PM
- i don't understand on the other hand, that no expert or tepco themselves came to these conclusions....by Edano 8/30/2011 12:00:22 AM
 @Edano I was just trying to work out how many hours you had been here I thought you had turned superhumanby elainekirk 8/30/2011 12:00:54 AM
- @elainekirk imagine, i've been operating patients as well 6 hours long today... :)by Edano 8/30/2011 12:02:04 AM
- @Peter Melzer did the HPCI (or how is it spelled) kick in in all 3 reactors ?by Edano 8/30/2011 12:03:37 AM
- @Edano , maybe they do, but in their own scholarly way they can only accept what is suggested, once they have looked inside. Dean once posted a document on the history of TMI core assessment. It took more than a decade to convince the experts that much of the core had melted down, because this was not supposed to happen.by Peter Melzer 8/30/2011 12:04:26 AM
- What does "SRV1 Open" on the graphs mean? www.tepco.co.jp I dont' see it defined in the text. Keep in mind that if Tepco can't change the data they've published, they could always create an ex-post facto song and dance around the data to try to 'edit' it that way. I'm skeptical as heck that they seem to be attributing a final fatal pressure fall to something planned.by Ian 8/30/2011 12:04:27 AM
- @you and : the HPCI leads to venting, right ?by Edano 8/30/2011 12:04:45 AM
- @Peter Melzer well, it's true, i did not doubt the NISA doc either until today. but i am far from being expert.by Edano 8/30/2011 12:06:56 AM
- SRV = Safety Relief Valve. This seems to be the full document that the Tepco graphics came from : www.kantei.go.jpby Ian 8/30/2011 12:09:11 AM
- Check out the graph on Unti 3 RPV on page 50 www.kantei.go.jp The black line for RPV Pressure (Analysis) shows dramatic fluctuation like we see in Ott et al. just before the fall in their model.by Ian 8/30/2011 12:13:12 AM
- @Edano , I have to check carefully, but I thought so. HPCI stands for high pressure coolant injection. It is a emergency cooling system composed of a booster pump and a turbine-driven pump that is supposed to inject water into the rpv at high pressure to cool the core and thus bring the rpv pressure down. It is unrelated to venting. Ian, the safety relief valves are supposed to open automatically to relieve pressure from the rpv into the suppression pool (aka wet well). How this worked is well explained here: www.ucsusa.orgby Peter Melzer 8/30/2011 12:15:34 AM
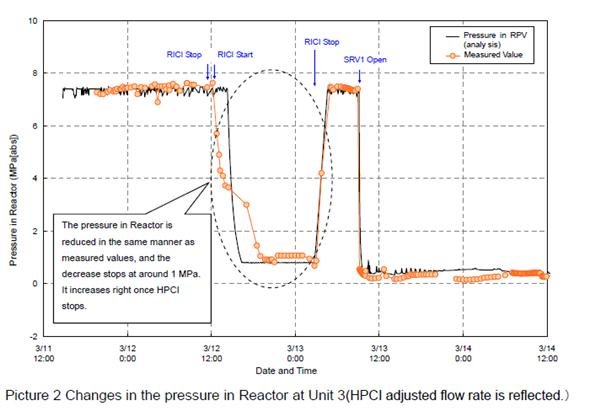
@ian: looks identical ! too identical ?
by Edano 8/30/2011 12:16:14 AM- @you : yes, it the same curve. same analisis.by Edano 8/30/2011 12:17:24 AM
- @Edano I suspect Tepco knew in as much as they're able to rapidly read and comprehend the raw data, and we can see they desperately tried various countermeasures. Looking at #3, for example, water is only injected into the reactor at around 9:25 on March 13 when, 'the operation for injection of water containing boric acid commenced using a fire extinguishing line'. According to the new theory this is right after the corium breached the vessel, but well before it dripped through onto the concrete.by es 8/30/2011 12:19:12 AM
- Here's evidence that they did activate a safety valve, from the March 13 2PM press release www.tepco.co.jp : "After that, safety relief valve has been opened manually, lowering the pressure level of the reactor, which was immediately followed by injection of boric acid water which absorbs neutron, into the reactor pressure vessel."by Ian 8/30/2011 12:19:54 AM
- @Peter Melzer : in #2 and #3 the HPCI timely corresponds to venting. coincidence ?by Edano 8/30/2011 12:20:49 AM
- @Ian this is the venting valve, i suppose.by Edano 8/30/2011 12:22:04 AM
Japan Earthquake | Page 2272
- Who's Blogging
-
 hudebnik
 alblee
 UKVal
UKVal Oliver (ScribbleLive)
 Jonathan Keebler
 kaykodh
 PKelley
 Markfm
 Angie
Angie Deb
Deb Mid Valley
 Pedro Jesus
 Matt (ScribbleLive)
 George Gibb
- elainekirk
- lillymunster
 dean
dean bo
bo- Edano
 IanGoddard