Japan Earthquake | Page 1222
 @pedro it will push the conversation of the page it is too large can it go on the wiki?by elainekirk 5/16/2011 10:32:28 PM
 JNN cam is sniffing around for something...by Rob in SF 5/16/2011 10:32:44 PM
 And the CTBTO spokesperson seems to be Swedish... 'Annika Thunborg, Spokesperson and Chief, Public Information annika.thunborg@ctbto.org' I'll try to send her an e-mail...by Jill in Sweden 5/16/2011 10:32:57 PM
 @elainekirk Sure, or I can link without the picture.by Pedro Jesus 5/16/2011 10:33:29 PM
 could the control rods paper link below be kept too - not necessarliy pinnedby UKVal 5/16/2011 10:35:32 PM
 @Jill in Sweden There are many isotopes for which we have no data. It will be easier to determine health risks for people in the northern hemisphere with a full set of data.by Bobby1 5/16/2011 10:36:32 PM
- anybody coming for the first time will not see the conversation because pins have taken it to the bottom of the page I think we need to decide what needs to be pinned and what can go in a doc/wiki/website linked by a pinby elainekirk 5/16/2011 10:37:50 PM
- @edano WELL DONE!!! @reed ty for videoby elainekirk 5/16/2011 10:40:22 PM
 @Edano Thank you very much Edano !by Reed 5/16/2011 10:41:40 PM
Fukushima Nuclear Radiation - Regional Effects from Rama Hoetzlein on Vimeo.
This animated map shows regional time-elapsed effects of the Fukushima Nuclear I Accident from March 11th to 30th, 2011. Details show how radiation moves over Ibaraki Prefecture, and falloff of particulate radiation with distance.
by Edano 5/16/2011 10:42:17 PM- now better ;)by Edano 5/16/2011 10:42:31 PM
- @elainekirk The schematics might be useful pinned up here because most people can't visualize the difference of a RPV, CV, primary containment, etc... =) Good work!by Pedro Jesus 5/16/2011 10:59:30 PM
 Morning everyone!!! Anyone care to give me an update of the last 12 hrs???by Angie 5/16/2011 11:00:03 PM
- @Bobby1 yes, absolutely. One thing I was thinking about is that the differences in levels of Cs is not that big between US and Europe (and they are low at this altitude they are measuring - ground is another issue)- which I suppose indicates quite rapid even dispersal over the entire hemisphere. I would have guessed larger differences. I suppose it tells us that if this had been a bit more serious (I am not saying that it is not serious) and they had lost control over the entire plant area and cooling of the common spent fuel pool - we would all get quite an equal share of the emissons (of course much more locally in Japan) ?? I guess that is why the authorities here were so nervous in teh beginning about the temp (and potential cracks) in the common spent fuel pool.by Jill in Sweden 5/16/2011 11:01:09 PM
 @Angie TEPPYtalk: "Oh my, the other two reactors seem to have melted too. Who could have known? But since they've been melted since the beginning, the situation is no worse." Or some such.by radioguy 5/16/2011 11:02:16 PM
- @radioguy Good to see they are consistant! Maybe though msm will pick it up again??? Nothing like a headline of "3 melted reactors" to sell a paper right?????by Angie 5/16/2011 11:04:11 PM
- @Jill in Sweden You have to be careful about assuming the measurements we have as being proxies for a whole continent. In Chernobyl, hotspots 50 times the mean concentration were routinely found. Without a truly dense measurement situation to obtain the distribution of nuclides, there will be significant numbers of people exposed to much higher levels of radionuclides than are indicated on the CTBTO graphs.by Bobby1 5/16/2011 11:14:47 PM
 @Edano, thanks for that animated video, wow! Notice that it's shortly after the Unit-3 blast on March 14th that radiation levels when sky high. Me thinks that may have been the major radiological event of the disaster to date.by Ian 5/16/2011 11:17:06 PM
 hi Angieby dean 5/16/2011 11:22:43 PM
- @Ian : i still think #3 explosion took place in containment and destructed it, leving rpv on open air.by Edano 5/16/2011 11:23:01 PM
 Z Microsystems Image Processor Enhances Video of Japanese Nuclear Power Plant in Real Time
- Powerful Processor Improves Image Clarity for Japanese Television Station -
Z Microsystems, a leading provider of field-ready computing systems, today announced that NHK, a major Japanese television station, is using the Z Microsystems Image Processor to improve the quality of live video coverage of the earthquake-damaged Fukushima Daiichi nuclear power plant. The Z Microsystems Image Processor is a high performance parallel processing platform that runs sophisticated image enhancement algorithms that dramatically improve the clarity of live video feeds.
Due to the high levels of radioactive contamination at the Fukushima Daiichi plant, news agencies are only allowed to conduct live coverage outside of the 30 km (18 mile) Fukushima zone. Even with high-definition video cameras and telephoto lenses, due to this long distance, the image quality of live video is blurry and lacks detail. The Z Microsystems Image Processor continuously clarifies images with contrast enhancement and edge detection, dynamically improving the quality of live video broadcasting.
“These image processing algorithms do a remarkable job of bringing out the detail from images degraded by poor visibility and challenging environmental conditions”
Keenly aware of its role in public safety, NHK was concerned about the potential risk to people and the environment posed by the Fukushima plant. Therefore, the station felt it was important to report on what was happening at the plant. Initially frustrated with the poor image quality, the station was very satisfied with the Z Microsystems Image Processor’s ability to clarify the video and provide more detail. Furthermore, the organization is considering using this technology for future coverage of news and events.
Full article here: www.businesswire.comby joniver 5/16/2011 11:23:09 PM- @dean Hi Dean!! looks like it got busy last night...........I am still trying to go back and catch up lolby Angie 5/16/2011 11:24:10 PM
 @Edano - I agree with thatby Lethbridgean 5/16/2011 11:24:25 PM
- @Bobby1, yes I am very well aware of it - some comes down with the rain in high concentrations. But still I would have expected a bigger differences even at the few datapoints that is there. The peak value from the initial events can be followed around the hemisphere and they do not differ so much. Anyway, no use discussing this too much before there is more databy Jill in Sweden 5/16/2011 11:24:56 PM
- I think Edano would get universal support on that theoryby dean 5/16/2011 11:25:07 PM
- @joniver Very interesting. Haven't heard from Z-Systems in a while.by Rob in SF 5/16/2011 11:25:23 PM
- @dean well, not quite. the c-pressure was normal in the first days after the explosion, and the thermal images seem to suggest an intact containment cap.by Edano 5/16/2011 11:30:07 PM
- @Rob in SF Ditto Rob.This is the first thing I've read about the camera, period.by joniver 5/16/2011 11:30:10 PM
- Edano.. I even thing gunderson kinda leans to that.. prompt critical in reactor accompanied with H2 explosionby dean 5/16/2011 11:32:07 PM
- @dean : the immense vertical blow can only be explained as originating from the cntmt bulb, me thinks.by Edano 5/16/2011 11:34:40 PM
 @Edano - Wouldn't that mean much higher radiation levels on-site?by Hank Scorpio 5/16/2011 11:37:29 PM
- @Pedro Jesus I am now at the other boardby Jill in Sweden 5/16/2011 11:39:16 PM
- @Hank Scorpio : i really don't know, but i imagine corium has been built within the first hours and this does not radiate that much (???)by Edano 5/16/2011 11:41:18 PM
- @Hank Scorpio - has the high rad levels really been accurately reported???? huh V***?by Lethbridgean 5/16/2011 11:42:22 PM
- @Edano, I wouldn't be surprised given the blast of radiation in the region shortly after. Maybe that yellow object we were puzzling over the other day is the blown off reactor lid. But wouldn't there be a bigger infrared signature of the overhead was looking straight down into an open reactor?by Ian 5/16/2011 11:44:55 PM
- Edano I agree with thatby dean 5/16/2011 11:48:07 PM
- a good theory until we get 100% verifiable proof. ie: a nice CAM shot looking directly down on the vesselby dean 5/16/2011 11:48:43 PM
- I meant to say: IF the overhead view was looking...by Ian 5/16/2011 11:49:13 PM
- undoubtedly there is evidence speaking against it. we'll have to wait until tepco lifts the truth.by Edano 5/16/2011 11:54:48 PM
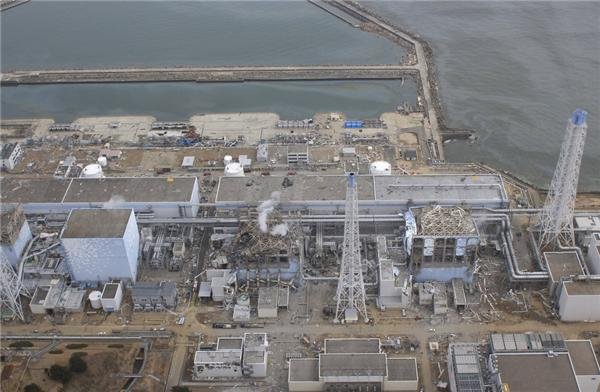
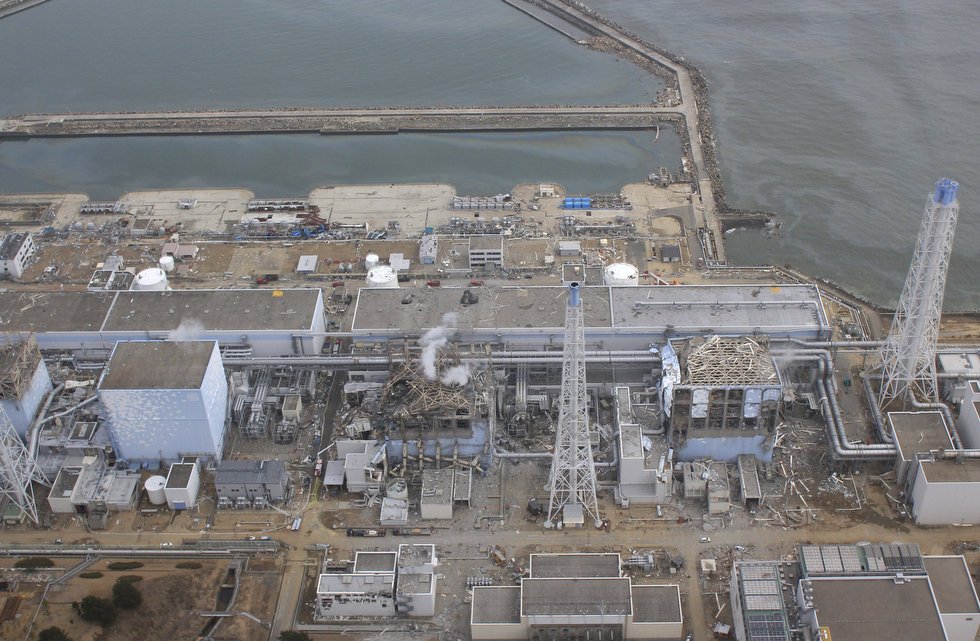
@Edano, to your theory, there are a number of photos of U3 that seem to show steam coming from the reactor's location (center East side), in addition to the fuel pool near the South-edge. In short, the steam sources suggests there are two bodies of hot water. Here's an example : media.oregonlive.com
by Ian via Media.oregonlive 5/16/2011 11:55:14 PM On the caps on #3. The RPV cap is likely still on due to some heat images that show a signature in a ring around like the gasket is leaking. The yellow containment cap, as far as the things I have looked at is anyone's guess. I do not know if the radiation readings give any sort of indication about it. Containment went to atmosphere pressure around the 20th based on older data Jo found. Things coming out today are hinting at possibly a big pressure drop for containment on the 16th. I have seen steam with pressure pushing it out of the reactor well tons of time from various angles. It isn't like the lightly wafting sfp steam. It seems to have pressure as it comes out. So if the corium has leaked out of the RPV does the containment cap (yellow one) situation become more of an issue?by Nancy 5/17/2011 12:00:51 AM
- @dean I added that link to your pin :)by elainekirk 5/17/2011 12:04:10 AM
- @Nancy : so the pressure did drop not long after the explosion ? older data showed about a week stable pressure.by Edano 5/17/2011 12:05:54 AM
- @joniver Do you (or anyone else) know how to access NHKby Nancy 5/17/2011 12:06:46 AM
- darn auto enter... NHK's video feed.by Nancy 5/17/2011 12:07:03 AM
Japan Earthquake | Page 1222
- Who's Blogging
-
 hudebnik
 alblee
 UKVal
UKVal Jonathan Keebler
 Oliver (ScribbleLive)
 kaykodh
 Markfm
- Angie
 Mid Valley
 Matt (ScribbleLive)
 George Gibb
- elainekirk
 PKelley
 lillymunster
 dean
dean bo
bo Edano
Edano Deb
Deb- Pedro Jesus
 IanGoddard