Japan Earthquake | Page 2181
 @hudebnik ty see you later have fun ~:)by elainekirk 8/18/2011 3:57:24 PM
 @dean Thanks for the spiderwort reference! Here's a related, though rather more technical, journal article - SOMATIC MUTATION RATE IN TRADESCANTIA STAMEN HAIRS AT LOW RADIATION LEVELS: FINDING OF LOW DOUBLING DOSES OF MUTATIONS: www.journalarchive.jst.go.jpby es 8/18/2011 4:01:46 PM
 Is that spiderwort plant something that could be implemented by people as some sort of low tech warning? IE putting one on your front step to see what it does?by lillymunster 8/18/2011 4:13:57 PM
 it's a plant whose little hairy stamens change from blue to pink in the presensce of radiation. Called a natural "geiger counter"; one that apparently is grown in clumps around some nuclear sites.
might be a good home companion.
Little reference on curezone.comby RadioGuy 8/18/2011 4:19:26 PM- @lillymunster I'd think it'd certainly be something worth experimenting with. Wouldn't surprise me if there were countless other species out there displaying similar somatic responses to radiation - we're just not aware of them.by es 8/18/2011 4:28:40 PM
 @elaine.. I wonder if you eat spyderwort plants if you change colors too when you get in radiation areas... "just kidding'by dean 8/18/2011 4:32:27 PM
- @lillymunster reading up on it it sounds good for people outside Japan but it sounds far too sensitive for fuku it reacts to radiation levels lower than can be measured with a counterby elainekirk 8/18/2011 4:32:27 PM
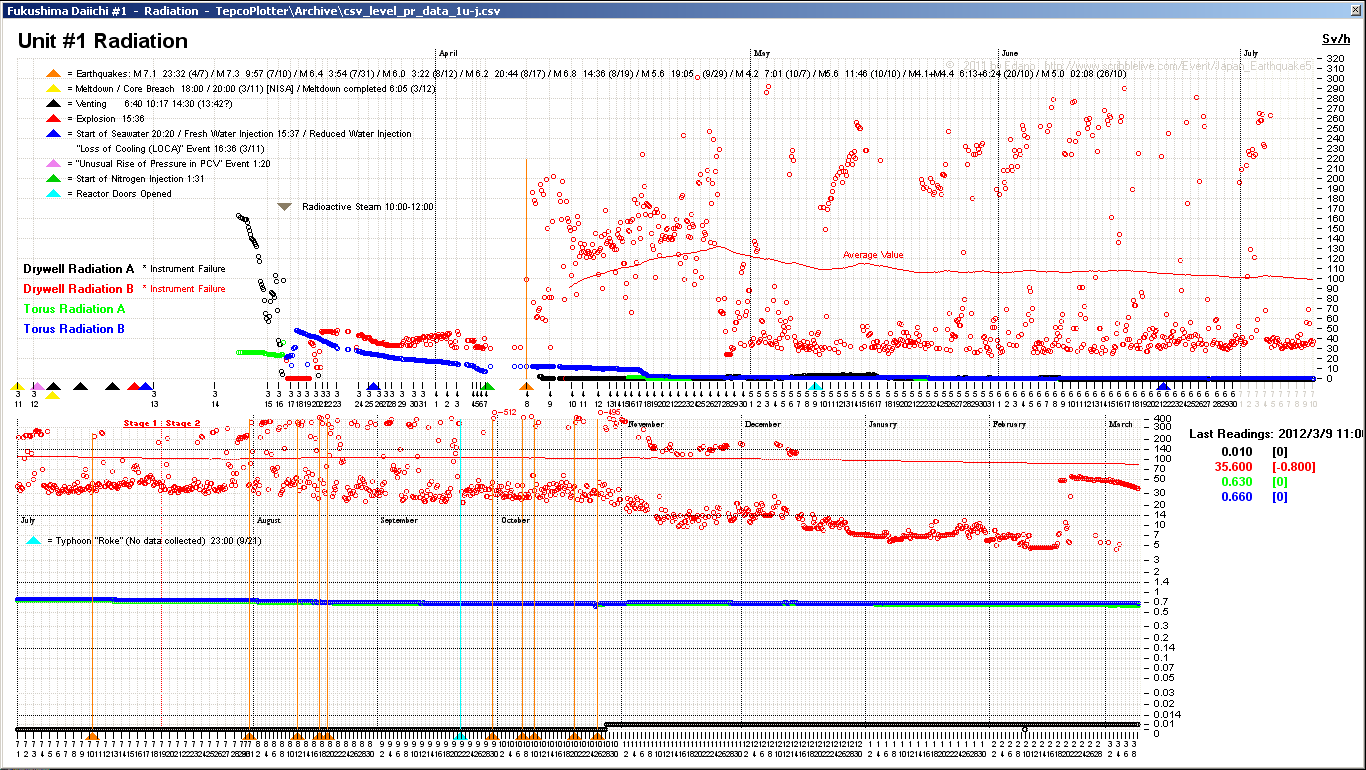
 "Highest Yet: 412 sieverts/hr in Reactor No. 1 dry well — Japan says ‘defective meter’"
enenews.com
interesting comment below: enenews.comby Vivre 8/18/2011 4:33:01 PM- @dean I should imagine so actually dean because an immune response would be pretty instant as it is so alien so colour/temp/heartr
ate but it is out of my field so we need @edanoby elainekirk 8/18/2011 4:34:24 PM - 412 Sv/hr converts to 412,000 REM/HOUR... that's up thereby dean 8/18/2011 4:34:43 PM
- pose it for Edano @ elaineby dean 8/18/2011 4:35:21 PM
- Dean can you comment on this guy's statement? It was on the enenews article. I don't know enough to know if it is correct.
Dear ENE’ers: As you can see from the graph above, the R1 corium here continues to spontaneously self re-set itself to produce neutron cascades with completely uncontrolled prompt/spontaneous criticality, maybe near “super-criticality” being reached. I believe this data, if the instrument is not broken (right!), shows the real possibility or likelihood of coming nuclear explosion at least with this corium, which appears to be in a stable mass and shape, such that it continues to self-induce neutron cascade criticality (fissioning) that is producing higher and higher levels of radioactivity. If the shape and mass of the corium are not altered, it will become more and more radioactive and the danger of nuclear explosion will increase for many many thousands of years. The trend is onward and upward. Someone several weeks ago had said that this chart chowed Sv/hr. contamination.
In my head, as an example of minimization where self enforced, I had replied to that individual, “wasn’t that millisieverts? [for the above R1 chart]“; but I was very wrong and had deluded myself. The drywell in R1 is showing multi-3-digit levels of Sieverts!
The very lowest numbers in the above graph would be more than enough to put most humans into an instant coma with death 100% certain in 100% of cases, within hours to a day or two. The unlucky would linger for several hours longer. The higher Sv numbers here would kill, and perhaps disintegrate a human’s tissues instantaneously to a kind of pulpy mash. The higher levels of radiation shown on this graph are definitely working to quickly warp, twist, disambiguate, and generally alter the metals and other construction materials “containing” above this very stable-SHAPE and stable-MASS of corium. I suspect that the construction, should it ever occur, of the plastic bag structure to obscure unit one is meant to keep anyone from seeing the building fall apart, as one likely purpose, since it will.by lillymunster 8/18/2011 4:35:38 PM - @Vivre that is no defective meter and even as an excuse it is old and discreditted , what happened? have the PR men all packed up and left the country? that one is older than the meltdowns...ok...not quite ...but nearlyby elainekirk 8/18/2011 4:35:59 PM
- reading now @ lillyby dean 8/18/2011 4:47:09 PM
- @elainekirk
to me the graph looks pretty consistent and gives no doubt about it's progression
I'm rather unsure about struggling with decimal values while low values may already be ponderous.by Vivre 8/18/2011 4:47:43 PM  i'm here now.by Edano 8/18/2011 4:48:54 PM
- 416 Sv/h is correct, and afterwards 412.by Edano 8/18/2011 4:49:55 PM
- @lillymunster i think "Edano" is okay. you can add (our group member) or something like that. i'll keep my name here.by Edano 8/18/2011 4:52:34 PM
- @lillymunster jst, tepco uses jst tokyo time.by Edano 8/18/2011 4:56:26 PM
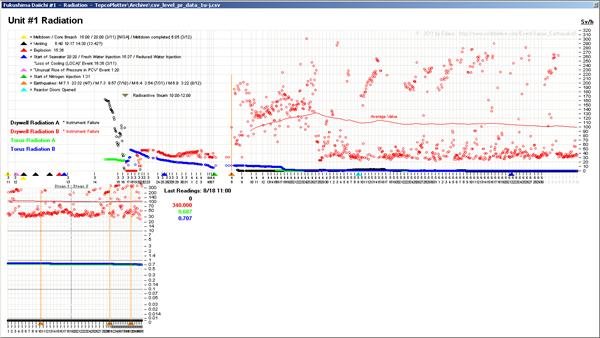
@Hank Scorpio meltdown 3 hours, core breach 5 hours, complete meltdown 15 hours, explosion 24 hours see here. www.houseoffoust.com
by Edano via Houseoffoust 8/18/2011 5:00:24 PM- reegarding radiation hormesis. i can't believe that we even discuss this nonsense. complete, ridiculous BS.by Edano 8/18/2011 5:05:25 PM
 @lillymunster Only a couple of insights on that article. It is not physically possible for that nuclear fuel present at Fukushima (or at any nuclear power plant for that matter) to sustain the high level of nuclear chain reactions required to cause a nuclear explosion. Also, your assessment of human exposure to radiation is contradicted by the Chernobyl experience where thousands of workers were doing 40-second-long shifts at locations exceeding 400Sv/h while cleaning the debris at the roofs of the crippled nuclear power plant's buildings. I think the guy might be referring to hydrogen explosions, not nuclear explosions.by Pedro Jesus 8/18/2011 5:09:40 PM
- @Pedro Jesus that wasn't my accessment - that was his - I just did a cut and paste on the comment over there because the explosion theory sounded odd.by lillymunster 8/18/2011 5:11:32 PM
- @lillymunster Oh, sorry, I thought you had mixed your own thoughts with the article on that comment. Well, but the guy either doesn't understand what he's talking about or he must have copy/pasted that article from a completely different context. Besides that, are those values correct, comparing to the official readings we've been following?by Pedro Jesus 8/18/2011 5:16:34 PM
 by George Gibb 8/18/2011 5:17:19 PM
- by George Gibb 8/18/2011 5:18:20 PM
- Google Earth map shows radiation at ground level
A Japanese nuclear agency has created a detailed map showing ground radiation levels within 100 kilometers of the Fukushima Daiichi plant.
The Japan Atomic Energy Agency made the map by having a survey team drive through the area in June. The team took readings of aerial radiation once every 10 seconds for several days along routes totaling 17,000 kilometers.
The map uses colors to indicate radiation levels and Google Earth technology to help users pinpoint locations.
The agency says the map is more detailed than those that show radiation levels based on data taken from high in the skies. For instance, it shows two sites that are only 100 meters away but whose radiation levels differ by a factor of 10.
The agency says it hopes the map will help evacuees decide whether it is safe to return home, and help government officials with decontaminating efforts.
Thursday, August 18, 2011 21:33 +0900 (JST)
www3.nhk.or.jpby Edano 8/18/2011 5:24:58 PM - and the link ?by Edano 8/18/2011 5:25:34 PM
- @Edano have you been able to find this map?by RonD 8/18/2011 5:25:44 PM
- @Edano I saw the nhk article earlier, did some looking but could not find this anywhereby RonD 8/18/2011 5:26:35 PM
- @RonD if i'm not completely wrong, google earth is a program you have to install. it is not google maps.by Edano 8/18/2011 5:26:45 PM
- I have ggole earth, I was looking for link to add the radiation info to the base google earth mappingby RonD 8/18/2011 5:27:51 PM
- @RonD ah, okay. i have no link for the rad data.by Edano 8/18/2011 5:28:35 PM
 I've found a couple of candidates www.airth.org and scarygliders.net Google Earth is indeed a program with a very useful ability to use 'overlays' which are excellent - there is for instancve a USGS one showing the world's recent earthquakes.by hudebnik 8/18/2011 5:29:05 PM
- It would be a widget within google earth. You have to download the program on your computer then it uses internet connection to feed data. Someone might have made an overlay let me go lookby lillymunster 8/18/2011 5:29:32 PM
- Here's one set of maps with data from MEXT loaded into a KML file. Not quite what we were seeking, but interesting anyway.
www.airth.orgby RadioGuy 8/18/2011 5:30:34 PM - Here's the KMZ link: www.airth.orgby RadioGuy 8/18/2011 5:31:31 PM
- @RadioGuy thats the type of KMZ info I was looking for, but that data
is from March not the newest info mentioned in the NHK articleby RonD 8/18/2011 5:33:52 PM 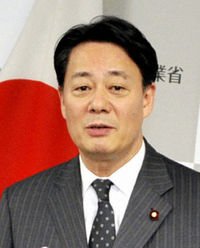
english.kyodonews.jp
bad news:
Industry minister Kaieda to run in DPJ leadership race
TOKYO, Aug. 18, Kyodo
Industry minister Banri Kaieda plans to run in the coming leadership race of the Democratic Party of Japan to choose a successor to Prime Minister Naoto Kan, sources close to Kaieda said Thursday.
Kaieda is considering announcing his decision later this month around the time when a bill to promote the use of renewable energy passes the House of Representatives, the sources said.
The ruling party, headed by Kan, and two major opposition parties agreed Thursday to pass the bill in the lower house next Tuesday. english.kyodonews.jpby Edano via English.kyodonews.jp 8/18/2011 5:34:03 PM- I wasn't able to immediately find the overlay in google earth. If anyone finds the file or a specific mention of the name of the overlay etc. I might be able to find it. If I can find it I should be able to do screen shots to explain it to those that don't want to install google earthby lillymunster 8/18/2011 5:34:05 PM
- @lillymunster I wonder if this info is for "official use"
, not general public infoby RonD 8/18/2011 5:35:19 PM - WOW! yes a KMZ file, you download it and open in google earth. Opened the MEXT one pretty crazy to visualize it. If they are using google earth they should release the file.by lillymunster 8/18/2011 5:35:56 PM
- why should nhk mention it if it is not public ?by Edano 8/18/2011 5:37:56 PM
- It's on the Pachube site, with the GoogleEarth plugin, but you'd think a KMZ file would be a good addition. There are, however, links to the raw, real-time Pachube rad data in multiple formats on this page: community.pachube.comby RadioGuy 8/18/2011 5:39:23 PM
- More, about the German who set up the API to scrape data from the PDFs into KML. blog.pachube.comby RadioGuy 8/18/2011 5:57:24 PM

Japan Earthquake | Page 2181
- Who's Blogging
-
 hudebnik
 alblee
 UKVal
UKVal Oliver (ScribbleLive)
 Jonathan Keebler
 kaykodh
 PKelley
 Markfm
 Angie
Angie Deb
Deb Mid Valley
- Pedro Jesus
 Matt (ScribbleLive)
- George Gibb
- elainekirk
- lillymunster
- dean
 bo
bo- Edano
 IanGoddard